New data · 16 October 2026
AI Exposure across Australia
About 1,265,700 Australians, or 11 per cent of people with a job, work in occupations with high automation exposure. Sydney - North Sydney and Hornsby (New South Wales) is the most exposed of the 89 regions we rank, with an average score of 42.6 out of 100 against 37.4 nationally. Based on the jobs people held at the 2021 Census and Jobs and Skills Australia's 2025 scores.
Updated 16 October 2026. Job counts come from the 2021 Census, taken in August 2021, so they are five years old. The Census was taken while New South Wales, Victoria and the ACT were in lockdown, and counts are by where people live, not where they work. The mix of jobs in an area may have changed since. 2026 Census data will be published when it becomes available in 2027.
- Australia
- 37.4out of 100
- Most exposed
- 42.6Sydney - North Sydney and Hornsby
- Least exposed
- 33.2Queensland - Outback
89 ABS regions (SA4)
Find your region
New South Wales 28
- Capital Region
- Central Coast
- Central West
- Coffs Harbour - Grafton
- Far West and Orana
- Hunter Valley exc Newcastle
- Illawarra
- Mid North Coast
- Murray
- New England and North West
- Newcastle and Lake Macquarie
- Richmond - Tweed
- Riverina
- Southern Highlands and Shoalhaven
- Sydney - Baulkham Hills and Hawkesbury
- Sydney - Blacktown
- Sydney - City and Inner South
- Sydney - Eastern Suburbs
- Sydney - Inner South West
- Sydney - Inner West
- Sydney - North Sydney and Hornsby
- Sydney - Northern Beaches
- Sydney - Outer South West
- Sydney - Outer West and Blue Mountains
- Sydney - Parramatta
- Sydney - Ryde
- Sydney - South West
- Sydney - Sutherland
Victoria 17
Queensland 19
South Australia 7
Western Australia 10
Northern Territory 2
Australian Capital Territory 1
Other Territories 1
The map
Exposure by region
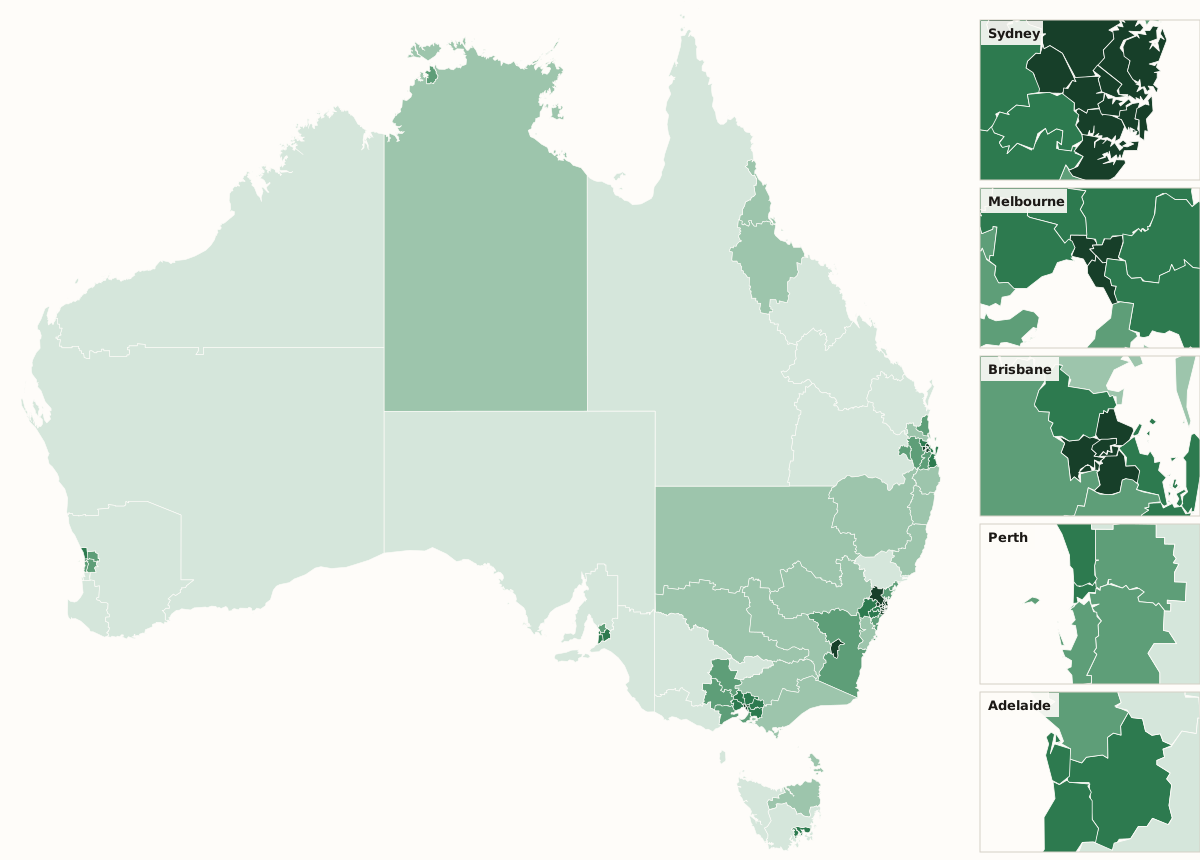
Across Australia
Jobs with high exposure across Australia
- General Clerks: 244,800 people, automation exposure score 71 out of 100
- Receptionists: 160,600 people, automation exposure score 66 out of 100
- Software and Applications Programmers: 116,900 people, automation exposure score 63 out of 100
- Accounting Clerks: 103,700 people, automation exposure score 71 out of 100
- Bookkeepers: 79,800 people, automation exposure score 69 out of 100
The score is Jobs and Skills Australia's measure of how much of an occupation's work generative AI could do. 94 per cent of employed people in Australia work in jobs that have a score.
A score of 60 or more means generative AI could automate much of the job's day-to-day tasks. It does not mean the job will go. The 60 cut-off is ours, not JSA's.
Five most exposed regions
- Sydney - North Sydney and Hornsby (NSW) 42.6
- Sydney - Ryde (NSW) 42.5
- Sydney - City and Inner South (NSW) 41.6
- Sydney - Inner West (NSW) 41.3
- Sydney - Eastern Suburbs (NSW) 41.3
Five least exposed regions
- Queensland - Outback (Qld) 33.2
- Western Australia - Outback (North) (WA) 33.2
- South Australia - South East (SA) 33.3
- Warrnambool and South West (Vic) 33.5
- Darling Downs - Maranoa (Qld) 33.5
By state and territory
Full ranking
All 89 regions, ranked

Free · about a minute
What about your job?
These scores are averages across everyone in an occupation. The free AI exposure check starts from your own job title. It takes about a minute, and you see how your job compares with every other job in Australia.
Changing Careers helps Australians in customer service, call centre and admin roles plan their next move. If you're ready to make it, the Sprint is twelve weeks of tools with a real Australian career coach.
Method
What the score means
- What Jobs and Skills Australia scored: how exposed each job's tasks are to automation by generative AI. Not job numbers, and not a forecast. Jobs and Skills Australia also measures augmentation, which this analysis does not use.
- How we combine it: each region's score is the average of its jobs' scores, weighted by how many people do each job. Jobs grouped too broadly to score ("not further defined"), and answers that were not stated or inadequately described, count as unscored.
- Coverage: the share of working people in jobs that have a score.
- Why some regions are hatched: a region is ranked only when at least 80 per cent of its working people are in scored jobs and at least five scored jobs are done there. Scores run from 33.2 to 42.6, so small differences in rank mean little.
- High exposure: A score of 60 or more means generative AI could automate much of the job's day-to-day tasks. It does not mean the job will go. The 60 cut-off is ours, not JSA's.
- Census counts are slightly adjusted by the ABS to protect privacy, so small numbers are rough. People counts on these pages are rounded to the nearest 100.
About this analysis
Who made it. Produced by Changing Careers, a paid career-transition service. Not affiliated with or endorsed by Jobs and Skills Australia or the Australian Bureau of Statistics.
What's new. Jobs and Skills Australia scores occupations. This analysis maps those scores onto where people live, region by region. This is the first edition, so there is no earlier figure to compare with.
What's changed
- 16 October 2026: First edition: 89 ABS regions (SA4), the states and territories, and Australia, from the 2021 Census and Jobs and Skills Australia's 2025 automation exposure scores.
Download and reuse
Free to reuse with attribution
Licence: CC BY 4.0. Based on Australian Bureau of Statistics data, Census of Population and Housing 2021 (TableBuilder), and Jobs and Skills Australia, Our Gen AI Transition: JSA AI Study Bespoke Tables (2025), CC BY 4.0. © Commonwealth of Australia, combined by Changing Careers.
Suggested citation: Changing Careers, AI exposure by region, 16 October 2026, https://changingcareers.com.au/ai-exposure-australia. CC BY 4.0.
We will update this when the ABS releases 2026 Census occupation data or when Jobs and Skills Australia updates its scores.